FITNESS: Understanding Training Metrics
If you have started logging your training on Strava, TrainingPeaks, Today's Plan or any other training software, you may feel a little bamboozled with all the acronyms.
Words: Anna Beck
Photos: Anna Beck/Matt Rouso
What the heck is FTP, CTL, ATL, TSS, TSB, HRV, IF, NP and EF? If you’re a Strava user what the heck is Suffer Score, Weighted Power, Fitness, Freshness and Form?
In this edition’s fitness article we will go through some key training metrics available on popular training platforms, how they relate to your training, and how you can harness this to increase your success on race day.

FTP: Functional threshold power
In essence this is the highest steady-state number you can hold for an hour, but if you get into the nitty gritty and look at data modeling, an FTP number can be sustainable between 40mins to just over an hour without any detriment to output, roughly mirroring maximal lactate steady state (MLSS).
FTP can be measured by many different protocols: and while they will all give you a good approximation, different phenotypes will flourish with different testing protocols. The gold standard is a sustained, maximal test of minimum 20 minutes, and up to an hour, and expressed in absolute watts or w/kg as a derivative of that value scaled for time.
FTP is important as it provides a quasi-ceiling for sustainable work, and is the benchmark for setting power zones.
NP: Normalised Power
Normalised Power is a metric that averages power across a workload, but also takes into account the different, largerstressor of efforts above threshold. Compared to average power, NP is used to compensate for changes in ride conditions or terrain, and gives you a more accurate picture of workload through the session. The more steady-state your workout is, the closer your average power and NP will be.
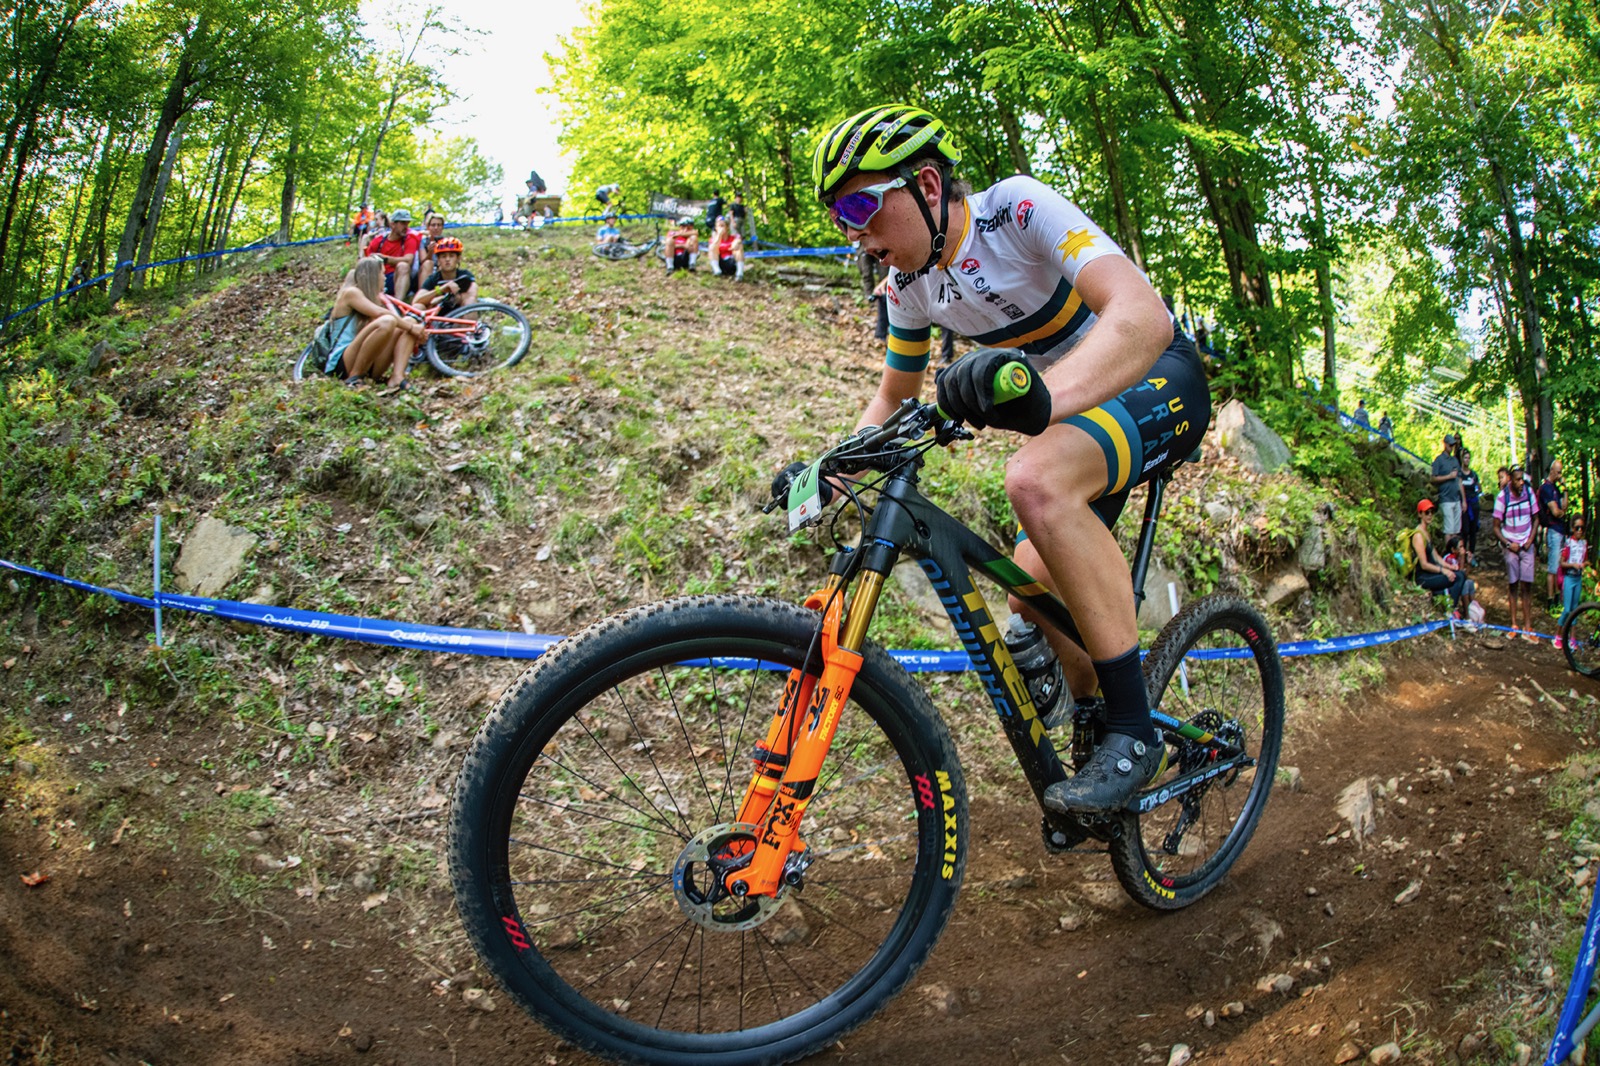
For example, a road time trial will elicit an average and NP that are virtually the same, if the course allows for pedalling the entire way. Contrast this to a criterium or XCO mountain bike race, where often average power is in the tempo or sub-threshold zone, pulled down by descents spent not pedalling. This interplay between average and NP is called Variability Index: which should be narrow (close to 1.0) for steady state events and higher for more stochastic events.
TSS: Training Stress Score
Each workout you complete and upload to training software will be attributed a TSS value, known in Strava as a ‘Training Load’. This score takes intensity of the workout: derived from your FTP or heart rate data, and marries it with duration to give you a number for the workout. For example a 60 minute workout at FTP or threshold HR should give a TSS of 100, whereas alternatively many endurance-based sessions may fall between 50–70TSS/hr, and a 30 minute cyclocross race may exceed threshold values and give you a TSS of 50!
To fully nerd out, this is the equation to generate TSS: TSS = (sec x NP x IF)/(FTP x 3600) x 100
IF: Intensity Factor
Intensity Factor—or ‘Suffer Score’ in Strava—is the number relating the the percentage of threshold worked at for the entire workload. An hour at threshold will yield an IF of 1.0, whereas endurance training may generate .6-.7 for a session, and race simulation work (ie: threshold efforts) may see an IF of .8-.95 (work and rest periods combined). 90min XCO Mountain bike races typically sit at an IF of .85-.95: ouch!

EF: Efficiency Factor
Efficiency Factor (EF) is NP from your workout divided by Average Heart rate from your workout. This can be useful in assessing changes in cardiovascular fitness across similar workouts at different times; through training increases in fitness will lead to a lower HR output for a given power.
VAM: Vertical Ascent in Metres
This is the average ascent, in metres, per hour of riding. It’s not good for much (IMO), but it can give you a clearer indication of the climbing demands of a course and solid bragging rights between mates.
CTL: Chronic Training Load
CTL is a metric that looks at a 42 day/6 week rolling average of Training Stress Scores. The aim of structured training is to gently raise your CTL and is often referred to as ‘fitness’. The idea is that as you increase your CTL the physiological changes occur that allow you to absorb higher training loads.
ATL: Acute Training Load
If CTL is your ‘fitness’, your ATL is your theoretical ‘fatigue’ measured as your training load for the past seven days, and as such has a greater indicator of how you feel in training than CTL.
TSB: Training Stress Balance
TSB (‘form’ in Strava jargon) is the playoff between CTL and ATL: if you have high CTL and complete an easy week on the bike (low ATL) your TSB will become more positive, and you will likely feel ‘fresher’. Likewise, if you have a very hard week relative to previous weeks, your TSB will rapidly become negative.
The interplay between CTL and ATL and finding what TSB athletes perfom best at is always a bit of trial and error–the art part of coaching–but most athletes do well with a TSB of +5-+20 to perform for major events.
Similarly, a level of negative TSB is desirable when training, as it’s an indicator of progressive overload at least, by the numbers. Through a program, blocks of higher TSB should correlate with easier rest weeks (lower ATL weeks!) periodically, to allow the athlete to adapt and supercompensate.
Metrics in Action
Let’s now have a look at these metrics in action, by analysing a file from an XCO race. This rider was on the podium in the master’s category.
Overview One
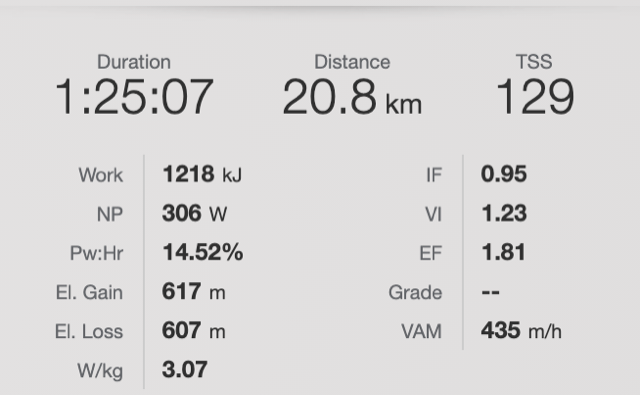
By having a global look at the file, we can see that the race was intense: with an IF of 0.95 for 85 minutes (remember: IF of 1.0 is riding threshold for an hour!), resulting in a TSS score of 129.
Overview Two
We can see that his average power is 249: tempo zone for this athlete, but when we look and NP a different story emerges: he has theoretically ridden just over ten watts under his threshold for the entire race. 620m of elevation over the 85 minutes reveals a VAM of 435m/hr.
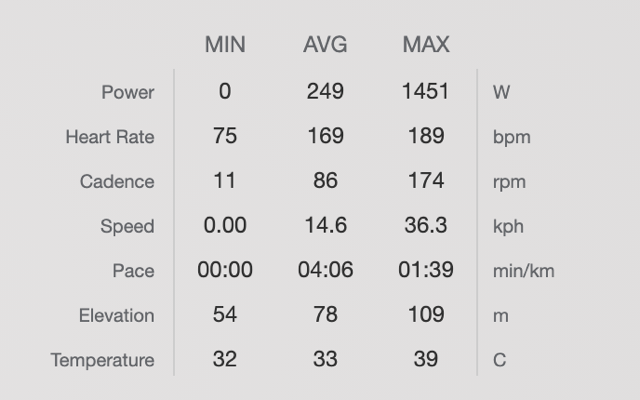
When you put these gleanings alongside average speed and cadence, it portrays a picture of a steep, technical race.
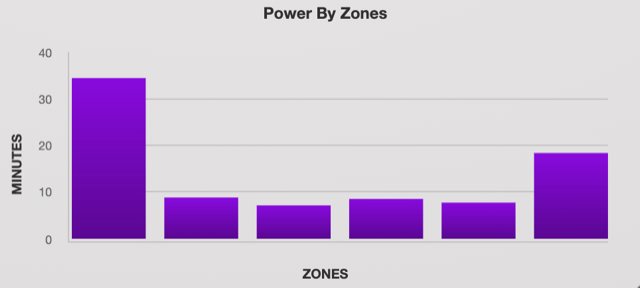
When we bring in charts of heart rate and power data it further illuminates this. We can see that just over 30% of the race was in the lowest power zone: 0-184w for this athlete, and highlights the time spent descending or small pedal strokes between features. Just over 40% of the race was spent collectively in the endurance, tempo, threshold zones VO2 zones. Another 25% of the race was spent in the anaerobic zones: an indicator that this athlete really pushed hard, that the race was riddled with efforts that could be sustained in this zone (40sec-2min) and perhaps that he was due a threshold test to validate the zones being used.
Power zones and Heart Rate zones
Here is an example of the lap: 3x climbs of 60–120 seconds (climb one, three and four though the last two are linked with a very small descent), with a longer more gradual climb (the second climb) of 3.5 minutes: you can see on the longer climb that power numbers (purple line) are up and down: it was a steep single track climb that demanded multiple anaerobic dips to power up.
Profile
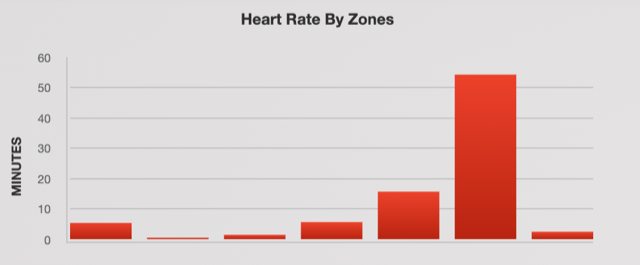
Comparatively, when we look at the heart rate of this athlete to find that he was working hard, even in that 30+% of the time he wasn’t pedalling! He spent 65% of the race over threshold, usually once again a driver of a raiding of heart rate zones, however when we put it into context with the heat (>33 degrees the whole race!) we can conclude that this race spent a few beats above what we would expect, is a result of temperature rather than a meaningful new heartrate threshold.
Subsequently, this athlete had a mighty 20W bump in power when tested 10 days later (having been on the comeback post injury), but when you have an understanding of the metrics it becomes almost second nature to identify threshold bumps, threshold drops and other changes in fitness.

