FITNESS: Understanding training metrics: the long game
Want go ride faster? Read on.
Photos: Nick Waygood
There are many more facets to elite performance than merely getting on your bike and riding, and while ‘just riding’ can form the basis of fitness and performance, there comes a point when structuring your training is required to progress.
In part one of these articles we discussed the multitude of acronyms regarding training sessions. If you haven’t read it, it will give you a better insight into this article and I urge you to do so before plowing forward here. In this article, we will discuss the significance of training metrics in planning a season.
Using Training Metrics in order to plan a season:
First things first: training metrics are a tool but they’re not the be all and end all. While there are guidelines for effectively using these metrics, they’re not foolproof.
Using training metrics effectively is dependent on having zones set accurately (and hence retested at intervals for power based athletes) and recording training correctly. While we have many other things in our life that can cause fatigue (life stress, running around with kids at a park, strength training) it’s debatable if adding these as a form of training stress is useful; after all, the endgame with cycling training is sporting performance, these things don’t contribute specifically to developing aerobic fitness.
Note keeping – the key to success:
Even if you haven’t paid attention to training metrics before, if you use any training software to track your rides, it’s an easy step to look back at races or times when you have felt really awesome and have a look at the numbers there. What was your fitness (CTL?), was your training stress balance (TSB) slightly negative? Neutral? +30? Looking back through the numbers gives us a good place to start when planning training moving forwards, and at the end of every season it’s a great idea to write out some notes on the season shape and key races, as well as low points (after all, we all have them!). You may find you perform well at +25, others may prefer -2.
From there you can assess your average volume to fine tune the ballpark of what you can easily sustain, as well as the weekly training load (expressed in Training Stress score/TSS or even hours a week) that has been manageable for you.
If you’re new to all this and looking at managing your own training, I urge a period of 6 weeks of monitoring your rides and fatigue to see your baseline looks like; what the average training stress in a week? What tends to cause a lot of fatigue? Are there any relationships between off the bike things in your life and fatigue (work deadlines, shift work, parenting etc).
Work backwards from the ‘Big Goal’:
In any season, it’s difficult to have a huge amount of priority races. Instead, We will look at a couple of races in a row over a two-three week period to be in peak form for, with other races as training races or lead-up races. This doesn’t mean you can’t perform well at the non-priority races: just that you are training focusing around peak performance at this time.
An easy way to do it is:
-Select your goal and count back the weeks to where you are now.
-Allow a short peak phase leading into the race of 1-2 weeks, preceded by a 4-8 week build phase.
-The weeks between where you’re at now and the build phase can be filled in by base weeks, sometimes if you have an extended period (>16 weeks) there may be cause to wedge a build week in there somewhere!)
How to work your weeks:
A traditional periodised approach will seek to build aerobic efficiency by building volume through base; this is typically where an athlete will peak in terms of hours/week or TSS.
Base:
-The least specific and more general (ie: both the XCO or gravity mountain biker will both head out for some long road rides, some general skill and strength endurance work), focusing on pushing up the functional threshold power (FTP) from below.
-Longest duration rides, skill based rides and strength: largest TSS/weeks and volume here.
-Gradually increasing volume weekly at a sustainable rate.
Build:
-Increasing specificity, maintaining high training load and a slight reduction in duration of sessions to account for increased intensity.
-Look at the demands of the event and seek to replicate them in training.
-Allow adequate rest between hard sessions.
-Bringing up the FTP from above.
-Higher Intensity factor (IF) or average intensity of rides.
-Maintaining FTP by maintaining some endurance and dedicated FTP sessions.
Peak period:
-There are multiple ways to construct a peak period, but the crux is reducing volume while maintaining intensity and ensuring there is adequate recovery between sessions.
-Hard workouts are still performed, however you may reduce the amount of efforts leading into the event while maintaining high output, therefore working towards your ‘optimal’ TSB for performance (as predicted from looking at previous data!) a good space to start though if you’re without data is +5-15 TSB.
-Workouts here are the most specific, event related workouts.
Recovery Weeks:
Most athletes will use a 2:1 or 3:1 work:rest cycle. This means for every 2 or 3 weeks, the athlete will have a week of reduced volume and intensity, usually in the range of 50-70% of the preceding week. Many athletes are loathe to conduct a recovery week, but I remind them: recovery is where the adaptation happens. Without recovery athletes become stagnant and can become demotivated.
How to assess metrics visually:
So that’s a lot of talking about the theory of managing a ‘season’, but it’s often better conveyed visually. In this chart, the performance manager chart (PMC), we see an athlete’s progression from off the couch, to racing a 60km, 1600m elevation mountain bike marathon.
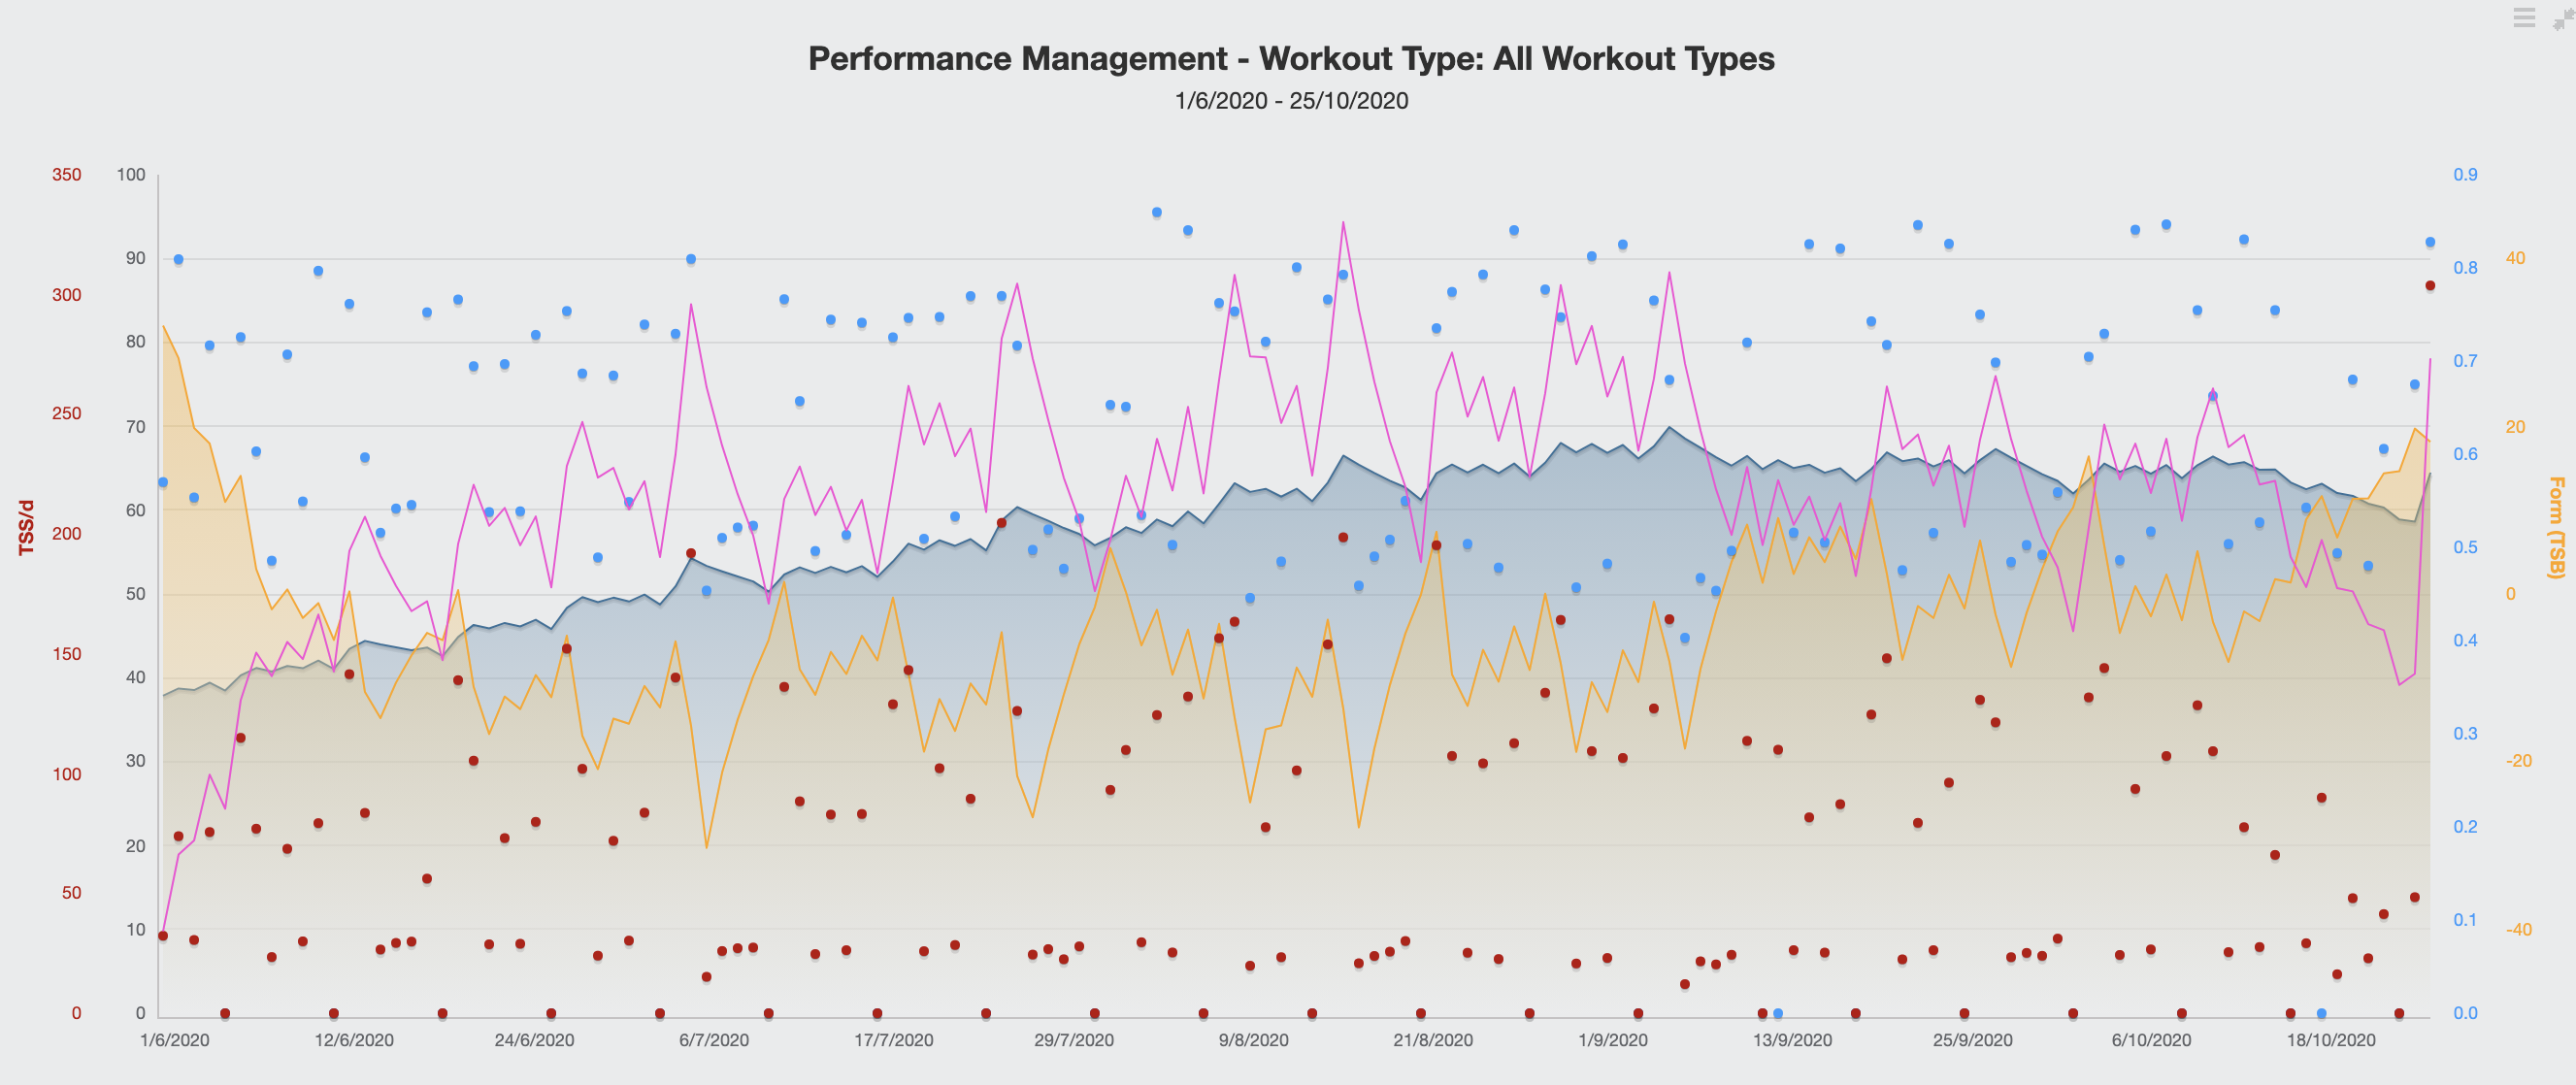
Visually, you can see the CTL or fitness gradually rising with occasional small peaks followed by small dips. Concurrently, in this graph the relationship between acute load (pink line) and fatigue (yellow fill) is very clearly represented; it’s obvious this athlete was systematic in the way he approached his training! Frequent rises in this athlete’s fatigue (yellow) indicate his recovery weeks.
You can also see in the graph that around 6 weeks from the end of the graph (his target race was at the end) was where his training load peaked, and while we did reduce volume slightly, the increase in intensity leading into the event meant that he was able to maintain a high training load right to the taper. The yellow peak at the end is where we instigated a taper leading into the event; shortened workouts with high intensity (albeit reduced reps of efforts) allowed his ‘freshness’ to increase, and he set a PB and bringing home some well-earned bling.
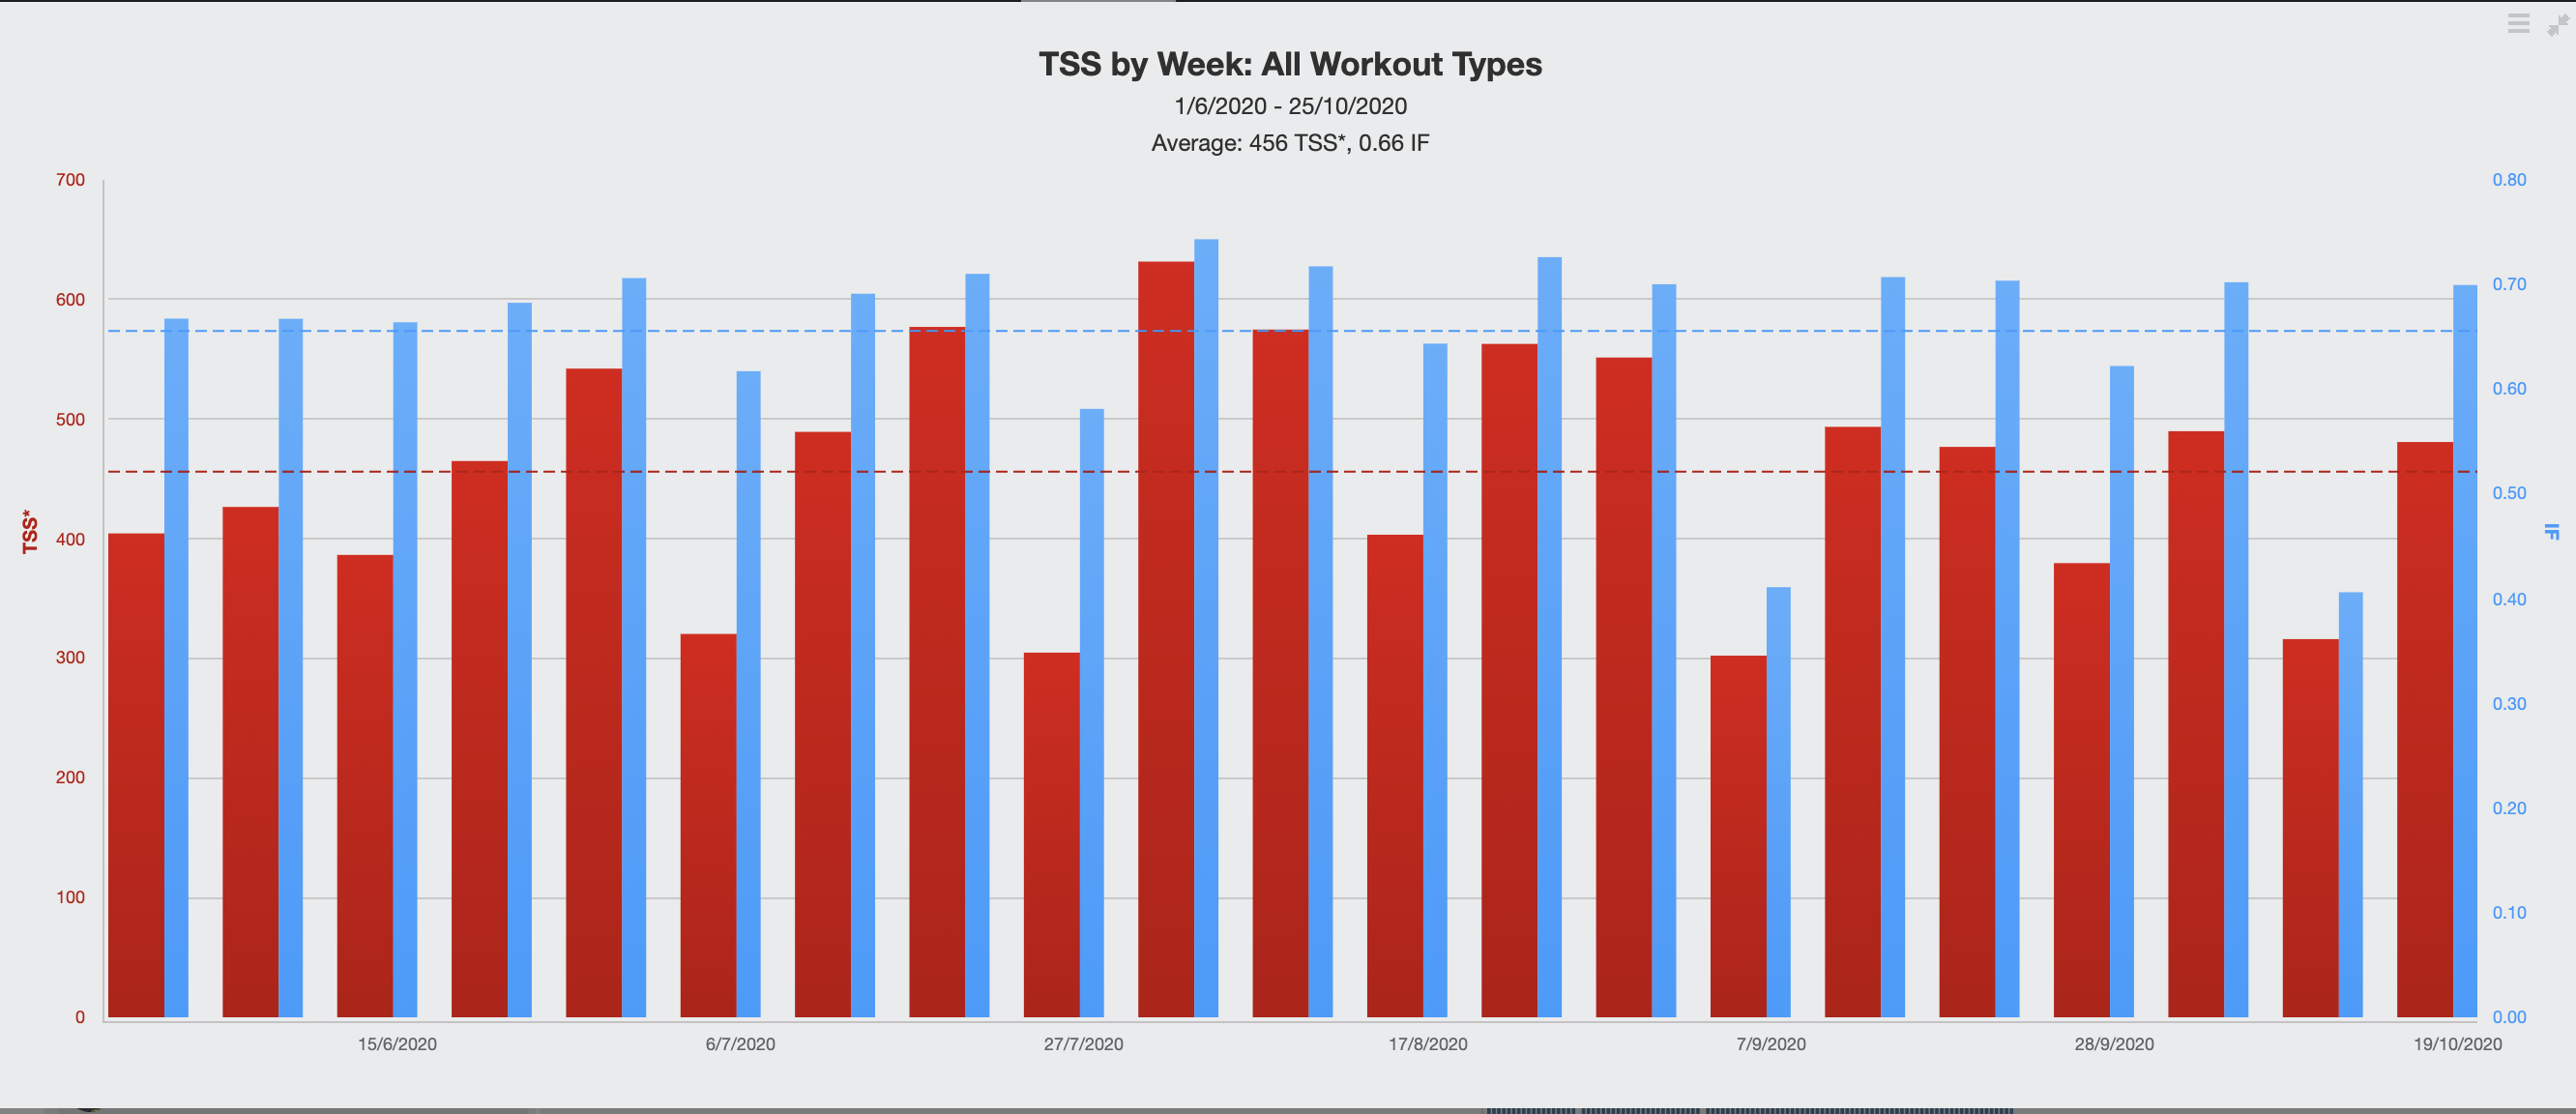
This masters rider identified that recovery was a challenge for him and we worked on. 2:1 work: rest recovery mesocycle, and this TSS/week chart (or weekly load), which really shows the three-weekly mesocycles.
Don’t live and die by the numbers:
This article outlines some simple ways to start managing your training load, using the numbers you generate on your cycling computer. It’s not the only way to train: there are many other methodologies aside from standard periodisation, however it’s a tried and tested method and a great place to start. That being said: the numbers are a great trend to follow but it can be risky staking all your confidence on curating a pretty online graph; especially at the expense of how you feel!
Interested in more training articles? Click here.

